Object Detection Visualization: Drawing bounding boxes for predictions
Written on October 23rd , 2023 by Alvaro Carranza
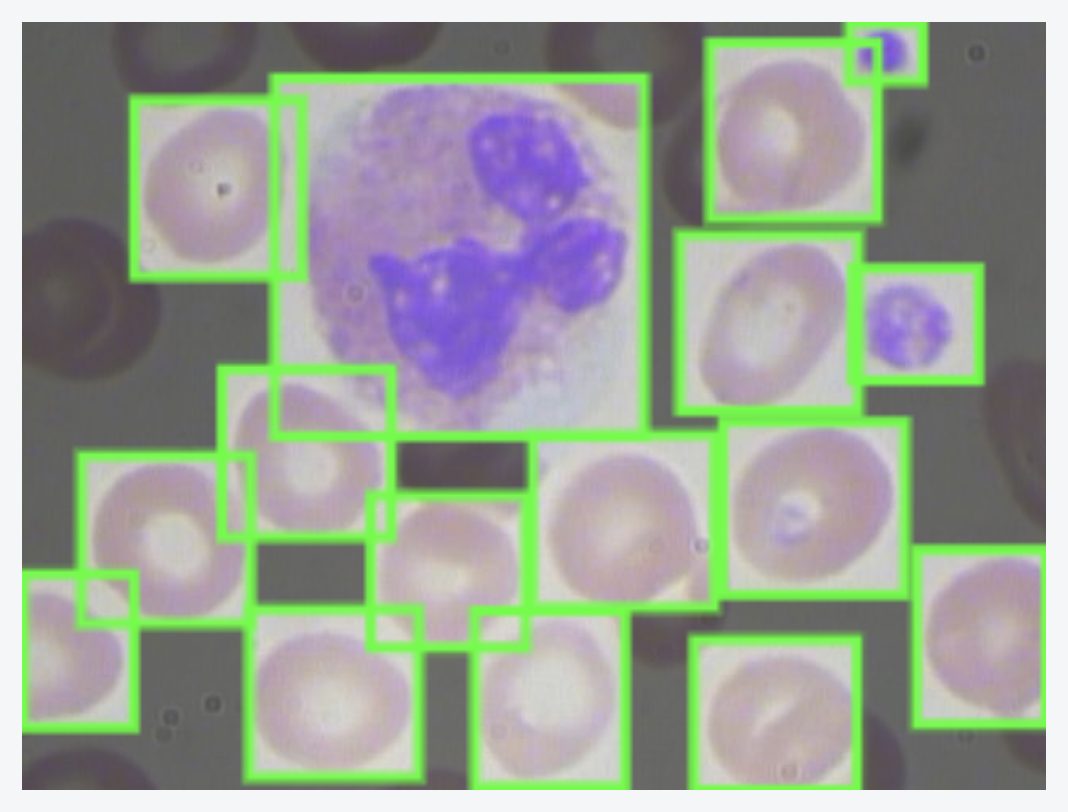
Image from BCCD Dataset (source)
Last week I wrote about labeling (image annotations) in object detection during the preprocessing stage. This time I will share another utility function I wrote in Python to tackle the visualization of predictions with bounding boxes. A bounding box is a rectangle that surrounds an object, specifying three pieces of information about said object:
- Position (pixels coordinates in an image)
- Class (Is it a cat? A dog? A person?)
- Confidence (how likely it is to be at that location)
By the end of the development of HS Detector Web App, a tool I developed - alongside 4 other students - for early detection of Hereditary Spherocytosis (an inherited blood disorder that happens when red blood cells are shaped like a sphere instead of a disk, named spherocytes), we decided to use Meta AI’s SAM - through Roboflow - as our Deep Learning model for deployment on Streamlit, after trying a couple of others (namely RetinaNet and Mask R-CNN).
Roboflow’s workflow is amazing and - apart from outputing a JSON file with the results - allowed us to integrate a direct image output with bounding boxes for predictions with no hassle (you can see it in action on the demo of the app on Youtube). The position and the class of the objects (red blood cells) detected is clearly shown on the output (each class has a different color as seen on the legend).

Output example of HS Detector Web App
However, we weren’t able to find a way to also display the confidence on the image (this is most likely possible with Roboflow, if you know how to please let me know). Due to time constraints, we used this output as it is still a functional tool in the current state.
In those last few hectic days before finishing the project, I wrote my own simple function to extract the information available on the JSON file with the help of OpenCV (Open Source Computer Vision Library) and display all three pieces of information on the image output (in this case only for the spherocyte class).
import json
import cv2 as cv

def draw_bboxes(img_file_path, json_file_path):
    img = cv.imread(img_file_path)

    with open(json_file_path, 'r') as json_file:
        json_data = json.load(json_file)

    for prediction in json_data['predictions']:
        xmin = int(prediction['x'] - prediction['width']/2)
        xmax = int(prediction['x'] + prediction['width']/2)
        ymin = int(prediction['y'] - prediction['height']/2)
        ymax = int(prediction['y'] + prediction['height']/2)

        class_name = prediction['class']
        confidence = prediction['confidence']

        if class_name == 'Spherocyte':
            cv.rectangle(img, (xmin, ymin), (xmax, ymax), (0, 255, 0), 2)

            text = f"{class_name}: {confidence:.2f}"
            cv.putText(img, text, (xmin - 25, ymin - 10),
                        cv.FONT_HERSHEY_SIMPLEX, 0.4, (80, 80, 80),
                        2)

    return img
Using the imshow() OpenCV’s method to display an image in a window, we get the following ouput:
cv.imshow(draw_bboxes(img_file, json_file))
# Where img_file is the uploaded blood smear image (input) and json_file is the prediction result (output)

Even if pre-existing similar tools were sometimes available, working on utility functions (both in the image annotation stage and for predictions’ visualization) helped me get a better understanding of inputs and outputs (in both cases in JSON format) for different object detection models.

